


networks
The Internet Under Lockdown: A Shift to the Suburbs
The coronavirus pandemic has caused half the world to be put into lockdown, putting unprecedented strain on networks. But it has also caused a shift in where the internet is being used. We look at Cloudflare data of key cities around the world to see how things have changed

The coronavirus has caused an unprecedented shift to working from home, with many organisations having to operate completely remotely for the first time in their history.
This has caused a dramatic global shift in internet traffic patterns, quite unlike anything previously seen in web use.
In order to highlight how much things have changed, web security giant Cloudflare used the data it normally collects to spot unusual activity in cities round the world, each of which is known as a Point of Presence.
Each of these is an edge router that effectively acts as a key node for users in that region, enabling activity in that area to be monitored for issues. But Cloudflare has used that information to visualise changes in traffic amid the coronavirus in major world cities, depicting traffic changes in green if they increased, and red if they decreased.
Showing the change between daytime traffic on two Wednesdays, 19 February and 18 March 2020, the result is a stark visualisation of how much people’s working lives have been upended.
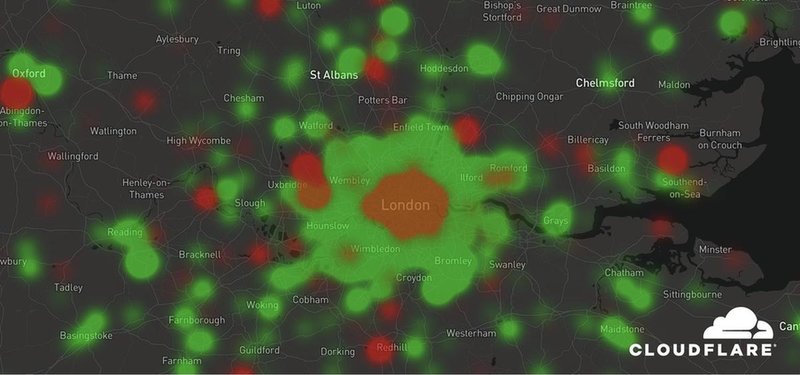
London, UK
If anyone ever doubted that central London was too expensive to live in, this image is surely proof. The city itself is a near-perfect donut, with a drop in the centre and growth in the suburbs, while key business and residential hubs, as well as the city’s airports, can clearly be seen in the surrounding counties.
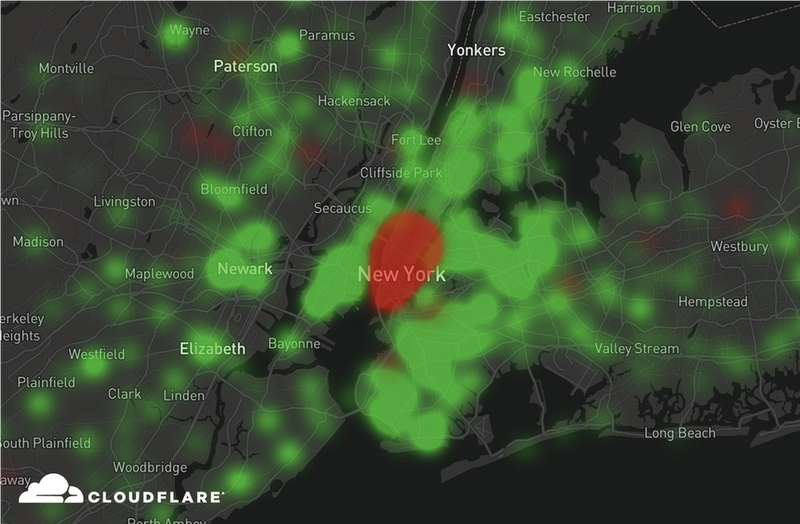
New York, US
As with London, New York is a city with a central business district at its core, primarily occupying Lower Manhattan. And here too, the stark shift from centre to suburbs can be seen.
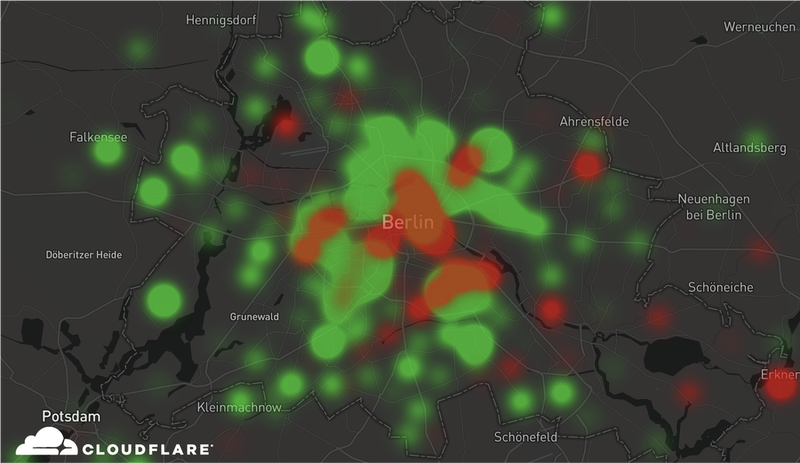
Berlin, Germany
Berlin, on the other hand, has more varied areas of business activity across the city, with residential clusters moving out into the country beyond, and providing this more dotted overall appearance. The small but bright red dot in the upper left is Berlin’s main airport.
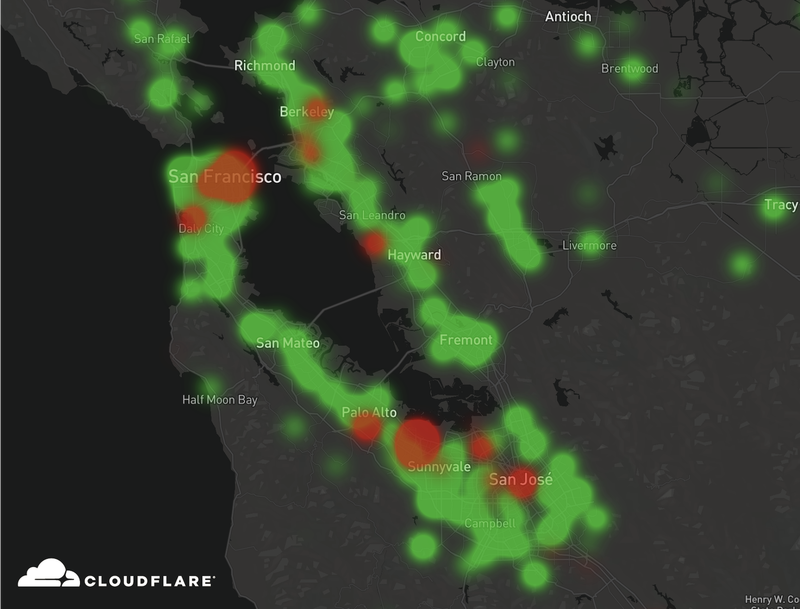
San Francisco Bay Area, US
The San Francisco Bay Area is dominated by hubs of tech startups and computing giants, which creates this dotted appearance. The red patch to the north shows a significant drop in San Francisco’s downtown region, while the tech hubs around Palo Alto, Cupertino and San Jose all highlight the scale of employees working remotely.
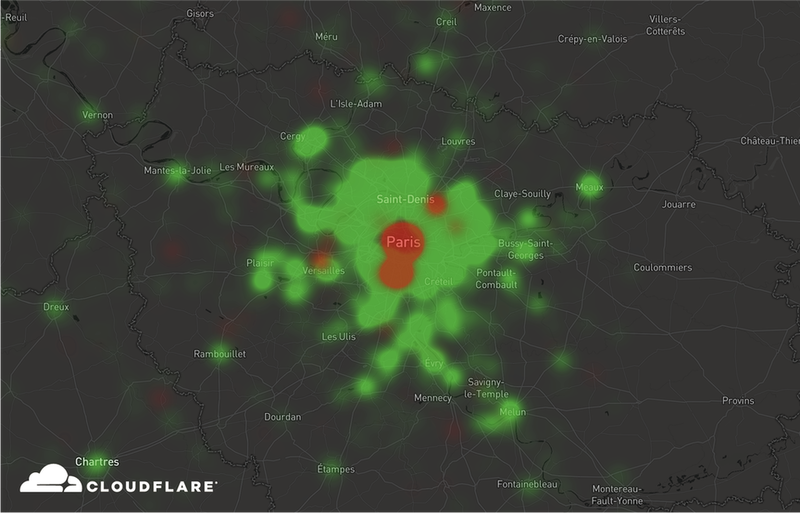
Paris, France
Paris’s more classic donut appearance highlights a traditional central business district, however, the two additional patches of red show traffic drop-offs for very different reasons. While the area of the north east is the city’s main airport and surrounding industrial zone, the area to the left is a key tourist attraction: the Palace of Versailles.
Images courtesy of Cloudflare
Back to top
Share this article


